by R. Grothmann
In this notebook, we analyze and plot cross product data of various countries in the world.
First we read the data into a matrix.
>B=readmatrix("crossproduct.dat");
The data contains one country in each row, and the cross product from 1980 to 2005 across the columns. We first sort the data using the last column.
>{b,i}=sort(B[:,-1]'); A=B[i];
Get the number of countries, and the number of years.
>nc=rows(A), ny=cols(A),
147
26
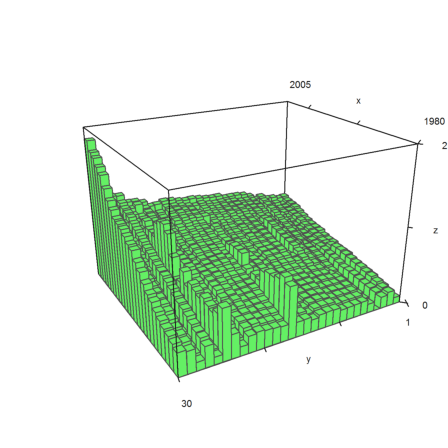
We extract the 30 best countries.
>A1=A[-30:-1];
And plot their development.
>plot3d(1980:2005,(1:30)',scalematrix(A1)*20,>bar, ...
   zoom=3,angle=240°);  ...
   insimg;
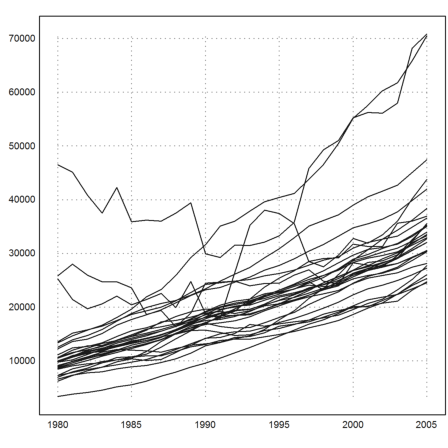
Here is line plot.
>plot2d(1980:2005,A1):
Next, we plot the development of the mean and the median of the cross products over the years.
>plot2d(1980:2005,mean(A')',a=1980,b=2005,c=0,d=15000); ...
 plot2d(1980:2005,median(A')',add=1,color=2); ...
 label("Mean",1992,7000,color=1); ...
 label("Median",1992,3600,color=2):
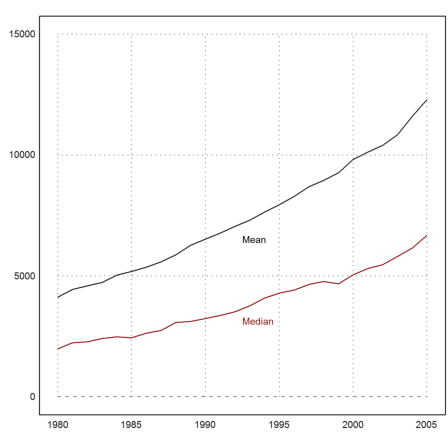
The result is that the meadian stays behind the development of the mean. In fact, the rich countries got rich faster than the poor countries.